
If you have not yet seen pt1, pt2 or pt3 of this series, I would encourage you to go and read those posts first.
This post is not an overview into what monitoring is, the right or wrong ways of implementing a monitoring solution or even about the pros and cons of ensuring a robust monitoring solution is in place. But, let’s assume we are in perfect harmony on why monitoring should not only be implemented… but, actively used. This post we will explore the out-of-the-box monitoring available for integrations in Oracle Integration Cloud.
Monitoring Integrations
Throughout this series, we have looked across the board at the monitoring capabilities for integrations in Oracle Integration Cloud. So… what is this particular post about?
Well, the other capabilities shown in the previous 3 posts on this subject, provide a high-level understanding of the health of your Oracle integration instance, but it doesn’t really show you where things might be going well or.. (hopefully not!) not so well.
This is why Oracle provide the ability to monitor individual integrations at a lower level of detail than the dashboard provides. To monitor integrations click Home > Monitoring > Integrations > Integrations.
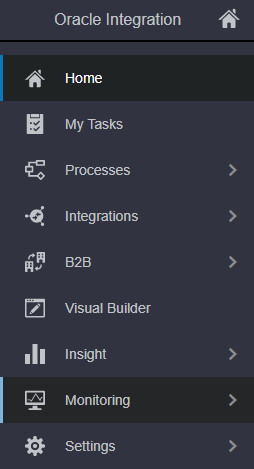
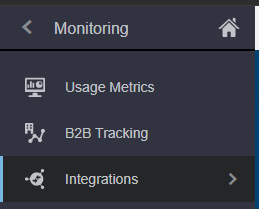
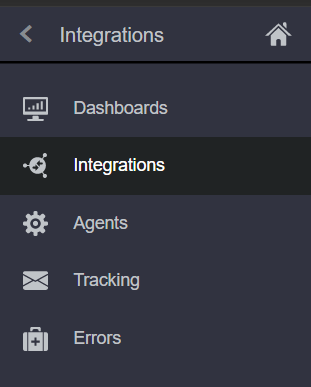
The integration monitoring page allows you to view the processing status of any activated integrations such as:
- How many messages have been received
- How many messages have been processed
- How many successful messages have occurred
- How many errors have occurred
- How many messages have been aborted
- The user who last scheduled the integration
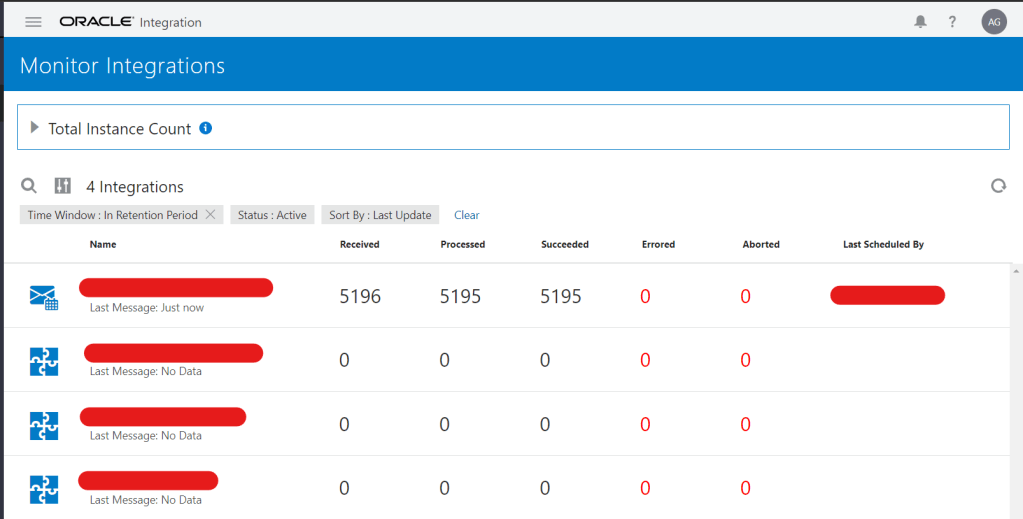
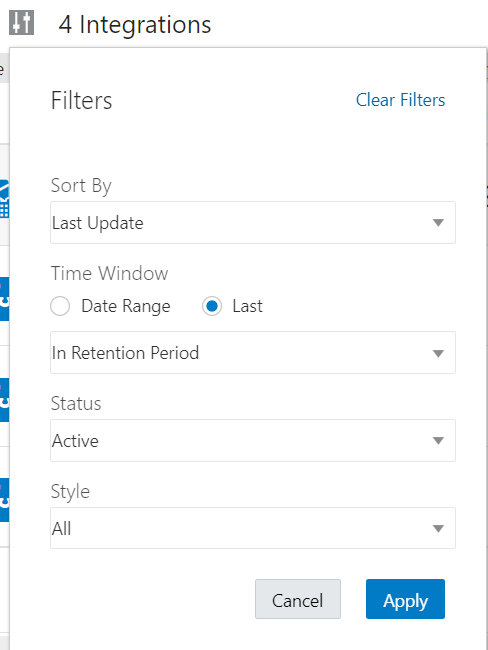
Should you wish to view statistics of de-activated integrations this can be done by using the filters available in the page. In addition you can sort the returned results by “Last Update” or “Name”, defined a date range from which to return results or filter by integration style.
Additional metrics can be observed in the form of Total Instance Count. Users should note that this is collapsed when the page loads as the data does not immediately fetch – this is due to the fact that with extensive amounts of data, the fetch can be time consuming

This total instance count shows the total message available in the various states that remain in the tracking store. This is why these metrics are different to that seen within the dashboard (part1) as, unlike the dashboard, this view only shows messages that have not yet been purged.
For scheduled integrations, this view provides the ability to submit the integration now, edit the schedule or pause the schedule. This might be particularly useful to re-play or pause an integration which has been failing.


By clicking on the numbers within the status columns, you will be navigated to the “Track Instances” page for “Received”, “Processed” or “Succeeded” integration instances and the “Errors” page for the “Errored” or “Aborted” integration instances. All of this, enables far easier debugging, monitoring and maintenance.
Summary
This post summarized the out-of-the-box capabilities available for monitoring OIC integrations using the the integration monitor. To read more about monitoring dashboard, design-time metrics, emails and agents, please see my subsequent posts!
Pingback: October 2022 - New OIC Articles - Implementing Oracle Integration Cloud