
Whenever we think about building any technical component, we have to consider many things such as performance, error handling, maintainability, etc. Arguably, all as important as one another. But, what about monitoring?
This post is not an overview into what monitoring is, the right or wrong ways of implementing a monitoring solution or even about the pros and cons of ensuring a robust monitoring solution is in place.
For avoidance of doubt... my views on monitoring are quite simple. Monitoring is JUST AS IMPORTANT as the system itself. Allowing for overall good health and stability of a solution. It WILL NOT fix your problems, but it will provide insights enabling proactive resolution of issues. Moving away from reactive, "break-fix" models just makes sense.Anyway… for the purposes of this blog post, let’s assume we are in perfect harmony on why monitoring should not only be implemented… but, actively used. This post we will explore the out-of-the-box dashboard monitoring capabilities for integrations in Oracle Integration Cloud.
OIC Monitoring Dashboard
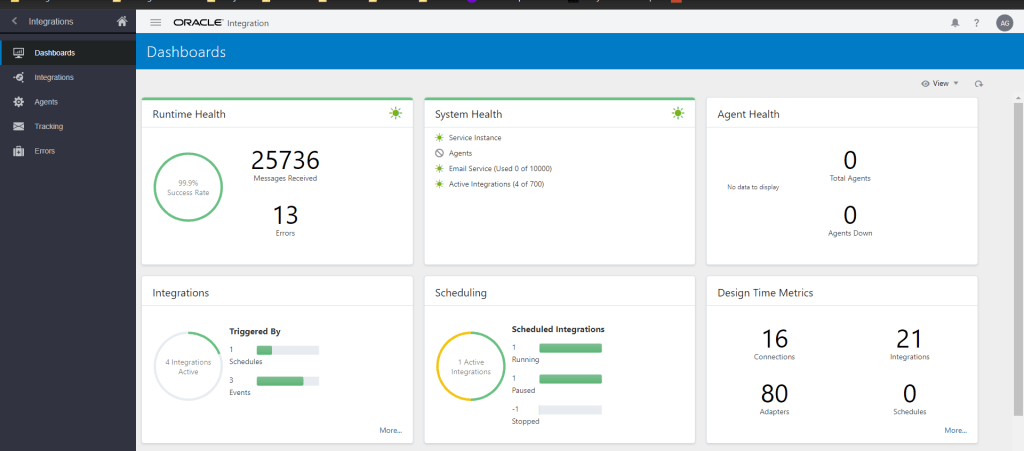
Oracle Integration provides a high-level dashboard containing information and tools helping to monitor and manage integrations in the runtime environment. The dashboard can be used to see how your integrations are performing and gives access to various view to check how your services are running. You can see a quick view into performance metrics for any integrations that are currently activated in your environment. The dashboard also provides a view of recent activity for running integrations and the ability to download all activities.
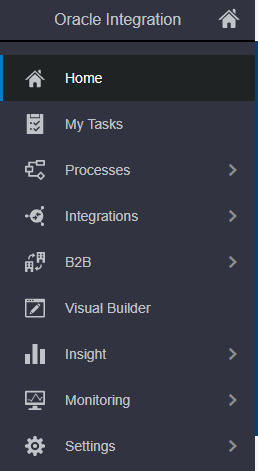
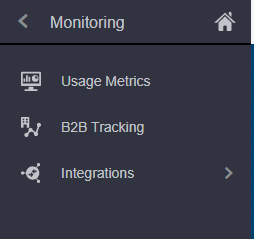
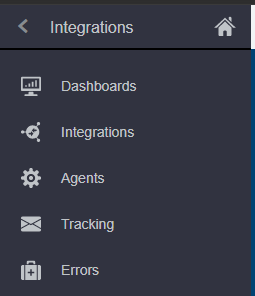
To view the dashboard, in the navigation pane, click Home > Monitoring > Integrations > Dashboards
The dashboards page can provide details as below:
- Success rates for messages (i.e, the number of messages that have been received and the number of messages with errors – since provisioning of the OIC instance)
- The health of the system, encompassing the service instance, agents, email service and active integrations.
- Agent health (i.e, number of agents vs the number of agents that are currently not running)
- Number of activated integration including how they were initiatied/triggered.
- Number of scheduled integrations and their corresponding status
- Metrics for design-time. i.e, a quick view of the number of connections, integrations, adapters and schedules defined.
- In addition, there are also graphs which visualize the hourly and daily history of instance statuses.
It is important to note that the dashboard seen in Oracle Integration Cloud reflects historical data. This data is collected hourly and so you might not seen instantly updating statistics on this page.
View the Activity Stream
Within the Oracle Integration dashboard, you can also view the integration activity streams. If you are familiar with Oracle Integration, you will know that each integration will produce and activity audit with message activity for any invoked/running/completed integrations. It provides information about the status of a message, activity or transaction and contains the payload throughout runtime of an integration. (if you are not familiar.. maybe I will cover that in a later post?).
From the dashboard page you can view the activity stream across all of your integrations, including downloading the activity stream logging file.
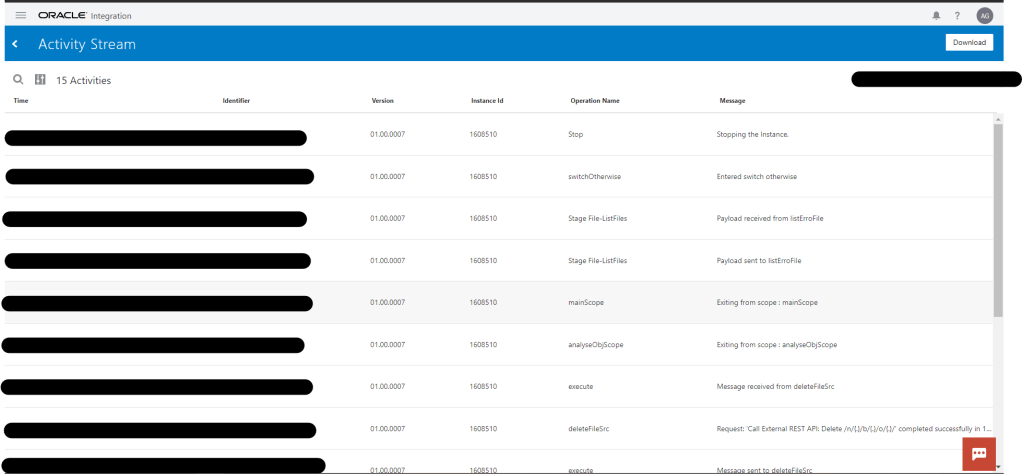
In order to view the activity stream, select View > Activity Stream in the dashboard page

NOTE – The total size of the activity stream is restricted to less than 100MB and the maximum payload size within an activity stream is 512KB – otherwise truncation will occur. If you need more than this, you will have to build in more complex logging features into your integration design.
View the Design-Time Audit
Similar to the activity stream, you can view the design-time audit from the dashboard by clicking View > Design-Time Audit. Again, similarly it is possible to download this audit.

This page shows audit detail about the the integrations configured in the instances. e.g, the locking and unlocking of integrations under-going further design work.
Summary
This post summarized the out-of-the-box capabilities available for monitoring OIC integrations using the dashboard. To read more about monitoring design-time metrics, emails, integrations and agents, please see my subsequent posts!
Pingback: Monitoring Integrations in Oracle Integration Cloud (OIC) – Pt2 | AMY SIMPSON-GRANGE – BLOG
Pingback: Monitoring Integrations in Oracle Integration Cloud (OIC) – Pt3 | AMY SIMPSON-GRANGE – BLOG
Pingback: Monitoring Integrations in Oracle Integration Cloud (OIC) – Pt4 | AMY SIMPSON-GRANGE – BLOG
Pingback: October 2022 - New OIC Articles - Implementing Oracle Integration Cloud