
If you have not yet seen pt1 of this series, I would encourage you first to go here to read it!
This post is not an overview into what monitoring is, the right or wrong ways of implementing a monitoring solution or even about the pros and cons of ensuring a robust monitoring solution is in place. But, let’s assume we are in perfect harmony on why monitoring should not only be implemented… but, actively used. This post we will explore the out-of-the-box design-time metrics available for integrations in Oracle Integration Cloud.
Viewing Design-Time Metrics
If you have managed to catch-up on pt1 of this series (here), you will recall that “Design-Time Metrics” could be seen on the Oracle Integration Cloud monitoring dashboard.
What I did not cover in that post was the fact that there is a “More…” hyperlink available.
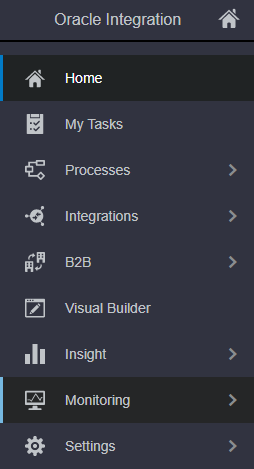
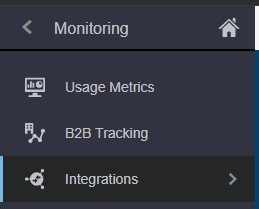
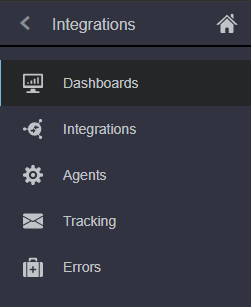
To view the design-time metrics of Oracle Integration Cloud, click Home > Monitoring > Integrations > Dashboards > More
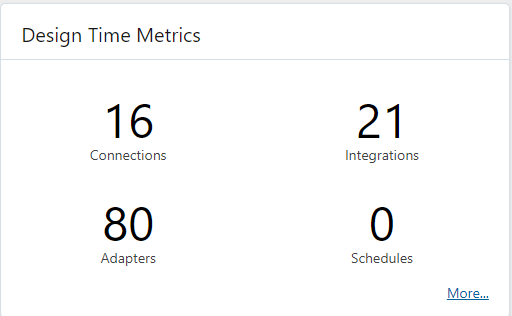
On this page, you can view metrics of all aspects of your integration design that is configured in the OIC instance. for example:
- The state of all integrations
- The state of connections
- The total number of lookups available including the total number of lookups in use
- The total number of packages available
- The total number of connectivity agents available
- The total number of adapters available
- The total number of libraries available
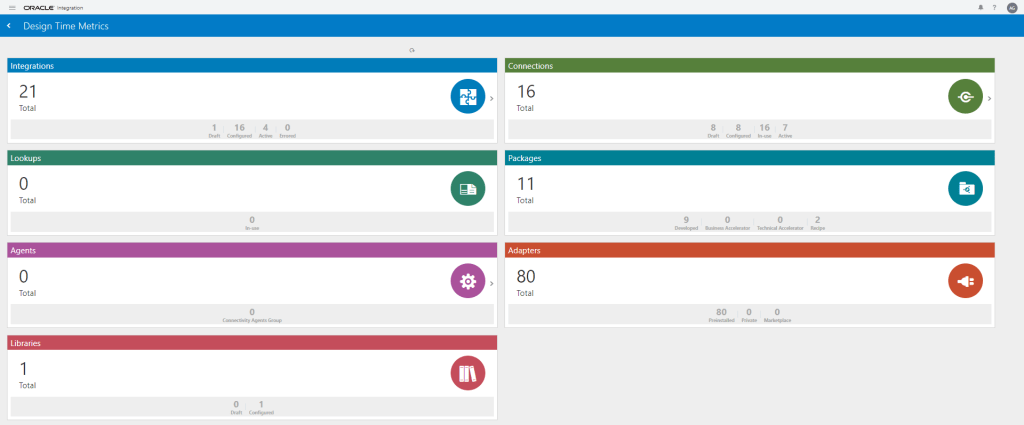
These metrics are particularly useful to identify redundant configured components. e.g do you have a bunch of “DRAFT” integrations, Connections or lookups that are simply not being used? if so, maybe it is time for a clean-up. Another good use is to identify the category of your packages – particularly the business or technical accelerators.
In some cases, these metrics are broken down further. You can see which by noticing the “>” icon within the metric box. This is present for integrations, connections and agents. As we are specifically looking at integrations in this post, I have broken down the further metrics available in the below imagery.
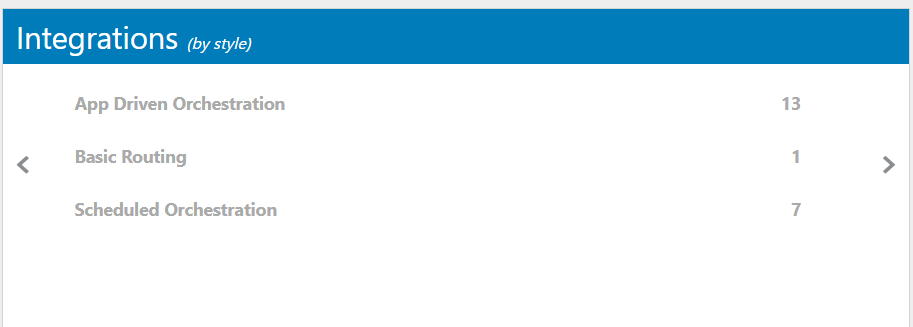
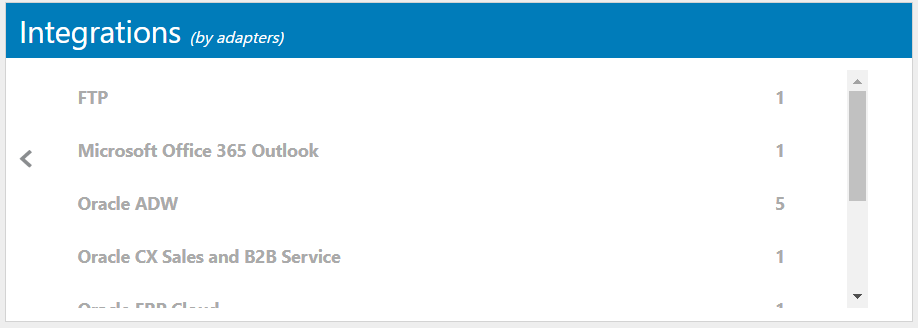
Within these metrics, you will only see those relevant to your instance. i.e, you will not see “0” next to a style or adapter. Therefore, in my “Integrations By Style” screenshot above, you will notice that I do not have any configured integrations using the following styles:
- Publish to OIC
- Subscribe to OIC
Summary
This post summarized the out-of-the-box capabilities available for monitoring OIC integrations using the design-time metrics. To read more about monitoring dashboard, emails, integrations and agents, please see my subsequent posts!
Pingback: Monitoring Integrations in Oracle Integration Cloud (OIC) – Pt3 | AMY SIMPSON-GRANGE – BLOG
Pingback: Monitoring Integrations in Oracle Integration Cloud (OIC) – Pt4 | AMY SIMPSON-GRANGE – BLOG